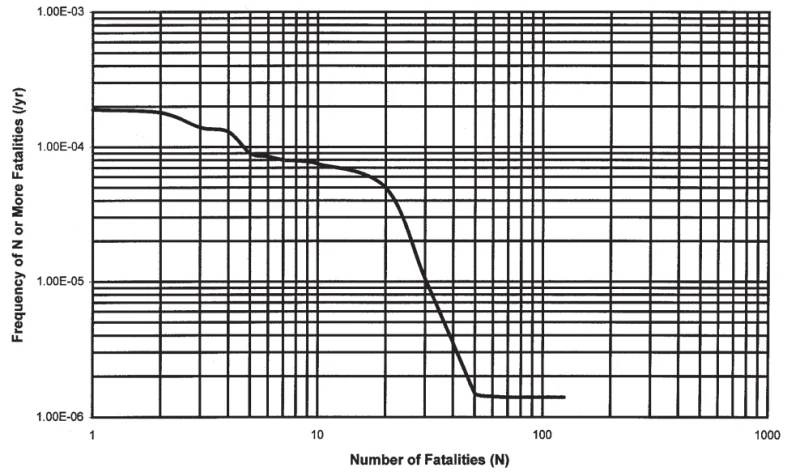
An F-N curve is a graphical representation that plots the cumulative frequency (F) versus the number of fatalities (N). This curve helps assess and compare risks by incorporating multiple scenarios into a single figure, called a F/N curve. Layers of Protection Analysis (LOPA) can be used to generate an F/N curve, but only if the consequence of each scenario is quantified in terms of fatalities, injuries, or business losses consistent with the organization’s risk tolerance criteria. The data shown on an F/N curve is only as accurate as the method used. The accuracy of the F/N curve is highly dependent on the reliability of the data and methodology used, making careful interpretation essential.
Benefits of Using an F/N Curve
An F/N curve is a powerful tool for risk visualization and assessment. It allows organizations to:
- Compare Risks to Tolerance Criteria: An F/N curve is useful for visually assessing the risk associated with a scenario or facility and to compare it to risk tolerance criteria that can be plotted on the same graph.
- Understand Baseline Risk: The frequency at which at least one fatality occurs provides a baseline risk for the scenario or facility which can be compared directly.
- Analyze Population Impact:
-
- A steep decline in the curve indicates risk exposure to a small population.
- A gradual decline suggests risk affecting a larger population.
- Comply with Regulatory Guidelines: Many industry safety standards emphasize higher intolerance for high-consequence events
Constructing an F/N Curve Using LOPA
To construct an F/N curve using LOPA, follow these systematic steps:
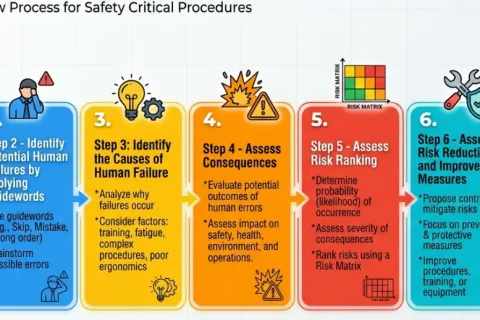
Step 1: Identify Scenarios:
- Generate all possible accident scenarios for the given facility or system.
Step 2: Determine Frequency of Each Scenario:
- Calculate the mitigated frequency (after considering Independent Protection Layers) for each scenario.
Step 3: Determine Fatalities for Each Scenario
- Assign the expected number of fatalities for each scenario.
Step 4: Calculate the Cumulative Frequency
- Start with the largest consequence (highest fatalities) and add the frequencies of all scenarios with that consequence. This forms the extreme right-hand point of the F/N curve.
Step 5: Continue Summing Frequencies for Successive Consequences
- Move to the next highest consequence, adding its frequency to the previous sum. This becomes the next point on the curve.
Step 6: Repeat Until the Lowest Consequence
- Continue this process for all levels of consequence until the lowest consequence (smallest number of fatalities) is reached.
Step 7: Ensure the Curve Reaches N = 1
- If the lowest scenario does not include one fatality, add a final point with N = 1 at the frequency calculated in the previous step.
Using LOPA for F/N curve analysis provides a structured approach to assessing cumulative risk. However, organizations should be cautious, ensuring accurate input data and aligning the analysis with risk tolerance criteria. By combining LOPA with F/N curves, industries can enhance process safety management, regulatory compliance, and decision-making for risk mitigation.
References:
Layers of Protection Analysis, Simplified Risk Assessment, by CCPS

Certified Functional Safety Professional (FSP, TÜV SÜD Germany), Certified HAZOP & PHA Facilitator, LOPA Practitioner, QRA/FERA and Specialist in SIL Verification & Functional Safety Lifecycle, with 18 years of professional experience in Plant Process Safety across Petroleum Refining and Fertilizer Complexes.