Process Flow Diagrams and Piping and Instrumentation Diagrams are more than just diagrams they are the language of process industries. These diagrams are the clear roadmaps for designing, building, and running complex systems. PFDs give you the big picture, guiding early design and planning, while P&IDs provide the detailed roadmap for building and running a plant safely. Whether you’re designing a new facility or troubleshooting an issue, mastering these tools will set you up for success.
What are Process Flow Diagrams and Piping and Instrumentation Diagrams?
Process Flow Diagrams and Piping and Instrumentation Diagrams are visual drawings for chemical plants. They help engineers, operators, and managers visualize how a process works, from the flow of materials to the intricate control systems keeping everything safe and efficient.
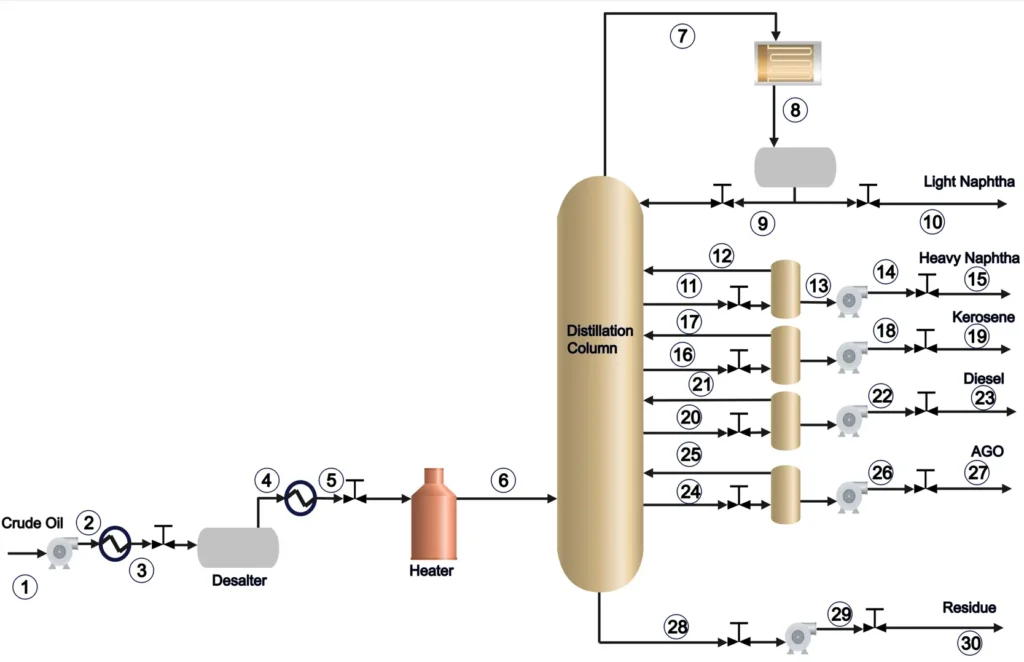
- Process Flow Diagram (PFD): A PFD outlines the main equipment, material flows, and operating conditions in a process. It’s the big-picture view that helps everyone understand how the plant works without getting lost in the details.
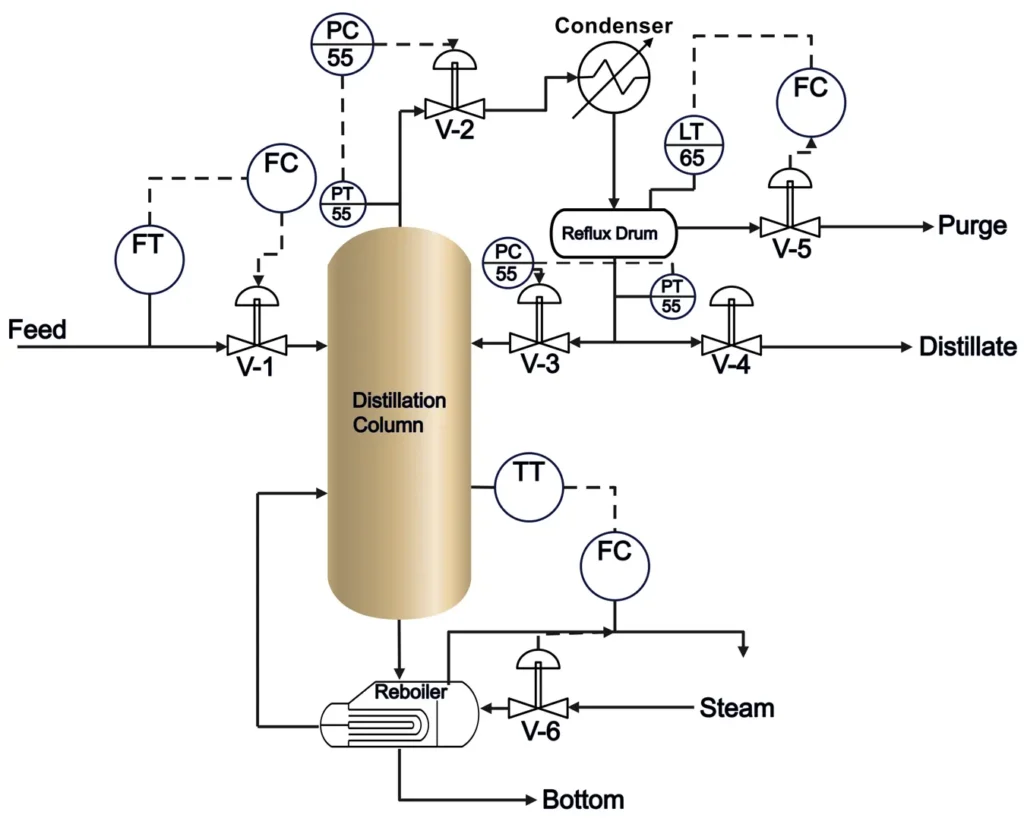
- Piping and Instrumentation Diagram (P&ID): A P&ID zooms in to show every pipe, valve, instrument, and control system, ensuring the process runs safely and efficiently. It’s the go-to guide for engineers and operators during design, construction, and operation.
Together, these diagrams are like a dynamic duo, guiding process industries like chemical manufacturing, oil and gas, and water treatment from concept to reality.
The Process Flow Diagram (PFD)
A PFD is your starting point in process design. It’s like sketching a simple flowchart to explain how materials move through a plant, from raw inputs to final products. PFDs focus on the essentials, making them perfect for planning, cost estimation, and communicating with stakeholders.
Key Features of a Process Flow Diagram
- Major Equipment: Shows critical components like reactors, pumps, heat exchangers, and separators using simple symbols.
- Material and Energy Flows: Displays flow rates, compositions, temperatures, and pressures of process streams. For example, a PFD might show 100,000 lb/hr of coal entering a carbonization process.
- Simplified Design: Leaves out intricate details like pipe sizes or control systems, keeping the focus on the process flow.
- Quantitative Data: Includes key numbers, like flow rates or operating conditions, often in tables for clarity.
Types of Process Flow Diagrams
PFDs come in different types depending on the need:
- Block Diagrams: The simplest form, using blocks to represent process stages. Great for summarizing complex processes.
- Pictorial Flowsheets: More detailed, with stylized equipment drawings following standards like BS 1553. These are common in professional design offices.
- Tabulated Data Flowsheets: Include a table at the bottom with stream data (e.g., flow rates, temperatures) for complex processes, making updates easy.
Why Are Process Flow Diagrams Important?
PFDs are the foundation of process engineering. They help:
- Plan and Design: Guide equipment sizing and process layout.
- Communicate: Simplify discussions with management or clients.
- Optimize: Allow engineers to test different process configurations for efficiency.
For instance, a PFD for formaldehyde production might show a methanol feed of 4000 kg/h, with stream data helping engineers size reactors or estimate utility needs.
The Piping and Instrumentation Diagram (P&ID)
If a PFD is the overview, a P&ID is the detailed. It’s the document engineers and operators turn to for how a plant is built and controlled. P&IDs are cross-disciplinary, involving process, piping, instrumentation, and mechanical details.
Key Features of a Piping and Instrumentation Diagram
- Detailed Equipment: Uses specific symbols to show equipment like centrifugal pumps or reactors, often with design details (e.g., a pump’s horsepower or material).
- Piping Specifications: Shows actual pipes, including sizes, materials (e.g., 2” carbon steel), and fittings.
- Instrumentation and Controls: Includes sensors (e.g., temperature transmitters), control valves, and loops to maintain process conditions.
- Safety Systems: Details alarms, interlocks, and relief valves to ensure safe operation.
Why Are Piping and Instrumentation Diagrams Critical?
P&IDs are important for plant operations. They:
- Guide Construction: Provide specs for piping, equipment, and instrumentation.
- Ensure Safety: Show control systems and safety features, crucial for HAZOP studies and OSHA compliance.
- Support Operations: Help operators troubleshoot issues and plan maintenance.
For example, a P&ID for a benzene production plant might detail a reactor with flow transmitters and safety interlocks, ensuring precise control and hazard prevention.
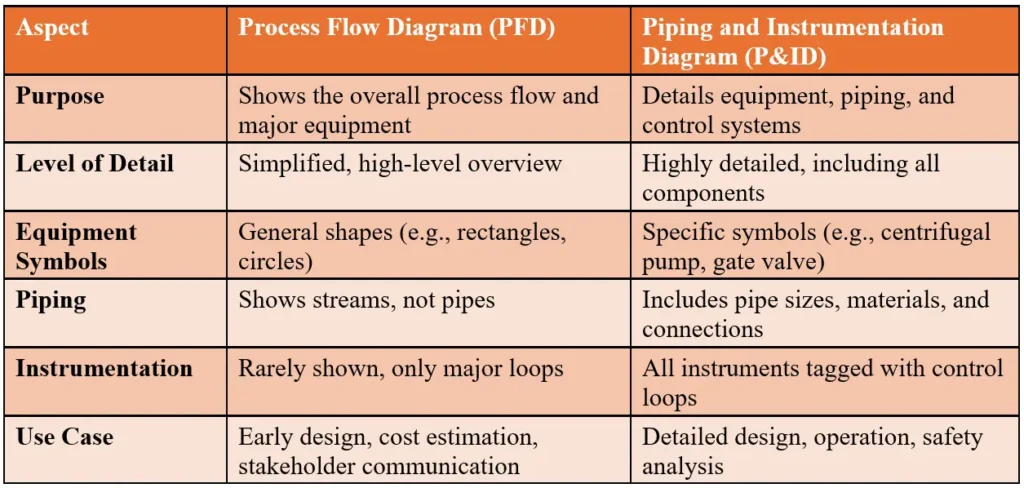
Process Flow Diagram vs. Piping and Instrumentation Diagram
To make the differences clear, here is a side-by-side look at PFDs and P&IDs:
How Are PFDs and P&IDs Created?
Creating a Process Flow Diagram
PFDs start with calculations based on the laws of conservation of mass and energy. Here’s the process:
- Material and Energy Balances: Calculate flow rates and compositions using stoichiometry or equilibrium data. For example, in a steam reforming process, engineers might calculate CO conversion to H2.
- Equipment Layout: Arrange equipment in the order of material flow, roughly to scale.
- Stream Data: Add flow rates, temperatures, and pressures, either on the diagram or in a table.
- Software Use: Tools like Aspen Plus or FLOSHEET help simulate and optimize complex processes.
Creating a Piping and Instrumentation Diagram
P&IDs build on PFDs, adding engineering details. The steps include:
- Start with PFD: Use the PFD as a foundation, identifying major equipment.
- Add Piping: Specify pipe sizes using piping formulas.
- Incorporate Controls: Add sensors, control valves, and loops (e.g., a pressure controller for a gas system).
- Include Safety Features: Add alarms, interlocks, and relief systems.
- Review and Revise: Use tools like Bluebeam Revu for collaborative feedback.
Why Are Process Flow Diagrams and Piping and Instrumentation Diagrams So Important?
- Design and Construction: PFDs guide initial planning, while P&IDs provide the specs for building the plant.
- Operation and Training: Operators use PFDs to understand the process and P&IDs to adjust controls or troubleshoot.
- Safety: P&IDs detail safety systems like interlocks and relief valves, critical for preventing incidents.
- Flexibility: P&IDs incorporate features like turndown ratios (e.g., 3:1 for a pump) to handle varying conditions.
Common Tools for Creating Process Flow Diagrams and Piping and Instrumentation Diagrams
Modern engineers rely on software to streamline diagram creation:
- Microsoft Visio: Great for basic PFDs and P&IDs.
- Aspen Plus: Ideal for process simulation and flowsheeting.
- Bluebeam Revu: Popular for collaborative P&ID reviews.
- SmartPlant P&ID: Links piping and equipment data for efficiency.
These tools ensure accuracy and save time, especially for complex plants.
Challenges and Tips for Success
Creating PFDs and P&IDs isn’t always easy. Common challenges include:
- Balancing Detail and Clarity: Too much detail can clutter diagrams; too little can miss critical info.
- Ensuring Safety: Hazardous processes need extra attention, like vent scrubbers for flammable gases.
- Standardization: Consistent symbols prevent confusion across teams.
Tips:
- Start with a block diagram to outline the process.
- Use standardized symbols for clarity.
- Validate calculations with software before finalizing.
- Keep P&IDs uncluttered by limiting to 4-5 pieces of equipment per page.
People Also Asked Questions with Answers
What is the difference between a PFD and a P&ID?
A PFD shows the overall process flow with major equipment and streams, while a P&ID details piping, instrumentation, and control systems for design and operation.
Why are PFDs important in chemical engineering?
PFDs help engineers plan processes, estimate costs, and communicate designs to stakeholders, forming the basis for detailed P&IDs.
How do P&IDs ensure plant safety?
P&IDs show safety features like relief valves and interlocks, used in HAZOP studies to identify and mitigate risks.
What software are used for PFDs and P&IDs?
Popular tools include Microsoft Visio, Aspen Plus, Bluebeam Revu, and SmartPlant P&ID for accurate and collaborative design.
References:
- Coulson, J. M., & Richardson, J. F. (1999). Chemical Engineering, Volume 6: Chemical Engineering Design. Butterworth-Heinemann.
- Thakore, Shuchen B., & Bhatt, B. I. (2007). Introduction to Process Engineering and Design. Tata McGraw-Hill Pub. Co. Ltd.
- Karre, A. V. (2023). Piping and Instrumentation Diagram: A Stepwise Approach. De Gruyter.
- James R. Couper, W. Roy Penney, James R. Fair, Stanley M. Walas (2005). Chemical Process Equipment – Selection and Design. Gulf Professional Publishing.
- Toghraei, Moe (2019). Piping and Instrumentation Diagram Development. First Edition. John Wiley & Sons, Inc.
- https://procad.com
- https://www.mxdprocess.com