Fault Tree Analysis (FTA) is a systematic and graphical method used to identify potential causes of system failures. It is widely utilized in industries such as aerospace, nuclear power, and chemical processing to ensure safety and reliability. This guide provides an in-depth understanding of FTA, its applications, development process, an illustrative example, and essential symbols, tailored for professionals seeking practical insights.
What is Fault Tree Analysis (FTA)?
Fault Tree Analysis is a top-down, deductive method of failure analysis that starts with a defined undesirable event (the “top event”) and maps all potential causes leading to it. By logically organizing these causes, professionals can evaluate system reliability and identify potential vulnerabilities.
FTA serves as a crucial tool in identifying root causes of failures, assessing the impact of single or combined failures, and supporting risk assessment during design and operation phases. It also helps professionals understand complex interdependencies within systems.
Applications of Fault Tree Analysis
Fault Tree Analysis plays a pivotal role in several critical industries, enhancing safety, dependability, and risk management.
Aerospace and Defense
- Facilitates safety analysis in avionics and propulsion systems.
- Ensures mission-critical components perform reliably.
Nuclear Power Plants
- Evaluates risks of core damage or containment failures.
- Aids compliance with stringent safety regulations.
Chemical Processing
- Identifies potential hazards in production processes.
- Develops strategies to mitigate operational risks and improve system reliability.
Transportation Systems
- Enhances safety in railways, automotive, and aviation sectors.
- Supports the design and validation of fail-safe systems.
Medical Devices
- Ensures reliability of life-support and diagnostic equipment.
- Addresses potential risks in complex medical systems.
How to Perform Fault Tree Analysis
Developing an effective Fault Tree Analysis involves a structured methodology. Below are the detailed steps:
1. Define the Top Event
Start by clearly specifying the undesirable event you wish to analyze, such as “Loss of power to a critical system.” This top event forms the focal point for the analysis.
2. Collect System Information
Gather comprehensive data on the system’s components, their functionality, and interactions. Identify potential failure modes and dependencies.
3. Construct the Fault Tree
Organize the causes leading to the top event using logical gates:
- AND Gate: All input events must occur to trigger the output event.
- OR Gate: Any input event can trigger the output event.
4. Perform Qualitative Analysis
Identify minimal cut sets, which are the smallest combinations of basic events that can lead to the top event. This step helps prioritize system weaknesses and failure risks.
Calculations for the below FTA diagram:
Rupture due to Corrosion = 0.2 * 0.8 = 0.16 PFD (Probability of failure on demand)
Rupture due to over pressure= PFD (PSV Fails) * PFD (Vessel Pressure Rise)
= PFD (PSV Fails) * (PFD of Pressure Control Loop Fails + PFD of High-Pressure Alarm Fails + PFD of CW Fails)
= 0.05 * (0.2 + 0.2 + 0.5) = 0.045 events per year
PFD of Vessel Rupture: Rupture due to Corrosion + Rupture due to over-pressure
= 0.16 + 0.045 = 0.61 events per year
Note: For OR Gate we add (sum) the values and for AND gate we multiply the values
5. Conduct Quantitative Analysis (if applicable)
Assign probabilities to basic events and calculate the likelihood of the top event using probabilistic models. This provides a numerical measure of system reliability or failure probability.
6. Validate and Review
Ensure the fault tree accurately represents the system. Validate the analysis through peer reviews, testing, or simulations.

Key Symbols in Fault Tree Analysis
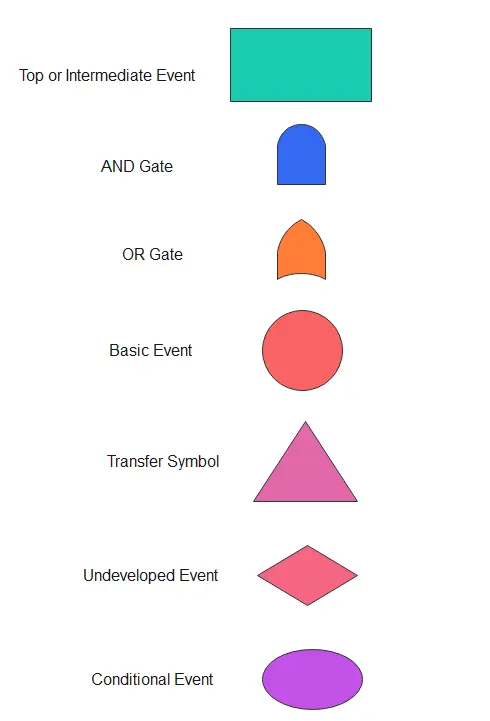
Symbols are integral to FTA, representing events and logical relationships. Here’s an overview:
- Basic Event: Represents a primary failure that cannot be further developed. Symbol: Circle.
- Intermediate Event: Results from one or more basic events. Symbol: Rectangle.
- Top Event: The main undesired event being analyzed. Symbol: Rectangle at the top.
- AND Gate: Indicates all input events must occur for the output event to happen. Symbol: Flat-bottom shape.
- OR Gate: Indicates any input event can cause the output event. Symbol: Curved-bottom shape.
- Transfer Symbol: Denotes a part of the fault tree developed elsewhere. Symbol: Triangle.
- Undeveloped Event: Represents an event not analyzed further due to insufficient data or priority. Symbol: Diamond.
- Conditional Event: refers to an event that occurs only if specific conditions or dependencies are met. It represents a situation where the probability of an event is influenced by other factors or prerequisites in the system. Symbol: Oval

Benefits of Fault Tree Analysis
- Provides a clear visualization of failure paths.
- Enhances risk management and safety planning.
- Facilitates compliance with industry regulations.
- Helps in resource allocation by identifying critical components.
For further information, discussion, and queries please comment in the box below or contact us at admin@ or follow us on Facebook & LinkedIn.


