Bathtub Curve Concept
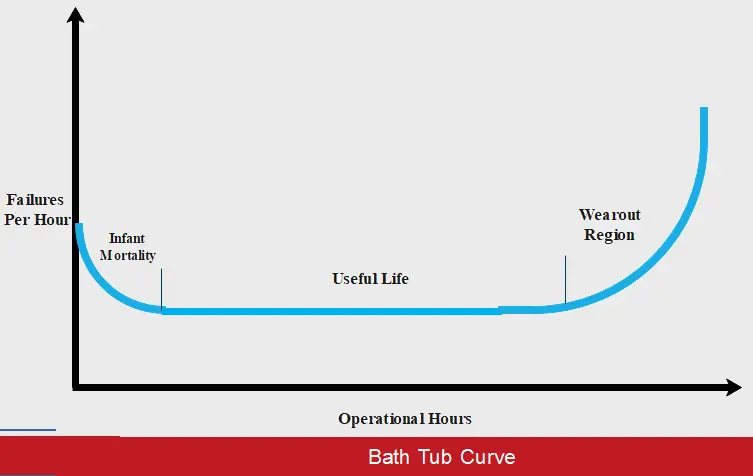
The bathtub curve is a concept used in reliability engineering to describe the failure rate of a system or component over time. It is named for its resemblance to the shape of a bathtub. The reliability of equipment over time is portrayed using a “bathtub” curve.
Managing equipment performance is important to prevent equipment failure from initiating Layers of Protection Analysis (LOPA) scenarios and from adversely affecting Independent Protection Layers (IPL), Probability of Failure on Demand (PFDs).
Three regions are distinct in the bathtub Curve. In the early portion of the plot, failure rates are higher. This area is called “infant mortality.” The middle portion of the curve is known as “useful life.” The final portion of the curve is called the “end of life” or “wearout region.”
1. Infant Mortality or Early Life Period
In the early portion of the bathtub, the failure rate is higher because weaker units in the population will fail first. As these weaker units are removed from the population, the failure rate goes down. This often occurs over a period of time involving a few weeks.
Immediately after installation, component failure rates can be higher due to manufacturing errors, incorrect material of construction, damage during shipment, and installation and commissioning errors.
This phase of early failures, represented in Region 1, is sometimes referred to as “infant mortality” or “burn-in.”Inspection, commissioning, and validation activities are used to identify and correct these failures.
A considerable effort has gone into the creation of procedures to identify and weed out weak units in manufacturing processes. Using accelerated screening techniques, most weak units can be identified within a few days.
2. Useful Life or Constant Rate Period
Generally, the early-life period is relatively short. This is followed by an extended time (commonly considered the useful life of the component), during which the average failure rate is much lower than in early life and is relatively constant. Failures during this “constant-rate” phase, represented by Region 2, tend to be
more random in nature.
The middle portion of the bathtub has a failure rate that remains relatively flat or declining as a function of operating time interval. Failures are primarily due to random stresses in the environment. During this period of time it is reasonable to assume that the failure rate is constant. While many consider this to be too conservative due to the fact that the failure rate is probably declining, this assumption simplifies the math and is very appropriate for probabilistic SIF verification.
3. Wearout Region or Wear-Out Period
The end of the bathtub curve occurs when the strength of the product declines (susceptibility increases). This is commonly known as “wearout.” Wearout occurs after several years but the mechanisms vary considerably depending on the type of component.
When the susceptibility of a component goes up, the failure rate increases rapidly. Manufacturers of instrumentation for safety instrumented applications will typically publish the useful life numbers for their products. A mechanical integrity program needs to address all instruments in safety applications before the end of their useful life.
References:
Guidelines for Initiating Events and Independent Protection Layers in Layer of Protection Analysis by CCPS

Certified Functional Safety Professional (FSP, TÜV SÜD Germany), Certified HAZOP & PHA Facilitator, LOPA Practitioner, QRA/FERA and Specialist in SIL Verification & Functional Safety Lifecycle, with 18 years of professional experience in Plant Process Safety across Petroleum Refining and Fertilizer Complexes.