Layers of Protection Analysis Methodology
LOPA (Layers of Protection Analysis) is a semi-quantitative method used to evaluate and analyze risk scenarios with significant consequences or the potential for major accidents. It assesses all available protection layers for a specific scenario and compares the calculated risk to an organization’s established risk tolerance criteria. If the risk is unacceptable, additional control measures or protective layers are recommended.
A scenario may require one or many protection layers depending on the process complexity and potential severity of a consequence. But for a given scenario, only one layer must work successfully for the consequence to be prevented. However, since no layer is perfectly effective, sufficient protection layers must be provided to render the risk of the accident tolerable.

Concept of LOPA
LOPA is limited to evaluating a single cause–consequence pair as a scenario. Once a cause–consequence pair is selected for analysis, the analyst can use LOPA to determine which engineering and administrative controls (safeguards) meet the definition of IPLs and then estimate the as-is risk of the scenario. The results can then be extended to make risk judgments and to help the analyst decide how much additional risk reduction may be required to reach a tolerable risk level. In many applications, the LOPA identify all cause–consequence pairs that can exceed the organization’s tolerance for risk.
LOPA evaluates risks in orders of magnitude (values in power of 10) of selected accidental scenarios and builds on the information developed in qualitative hazard analysis techniques like the HAZOP study. LOPA is limited to evaluating a single cause-consequence pair as a scenario. After the process is designed to minimize risk, the residual risk can be managed using the IPLs identified in a LOPA.
LOPA is especially used to determine the safety integrity level (SIL) of safety instrumented functions in conjunction with IEC 61511, but also as a general risk assessment tool to evaluate if the protection layers in a system are satisfactory.
LOPA can be applied at any point in the lifecycle of a project or process, but it is most cost-effective when implemented during front-end loading when process flow diagrams are complete, and the P&IDs are under development. For existing processes, LOPA should be used during or after the HAZOP review or revalidation. Also, during the operations and maintenance stage, when modifications are going to be made to an existing process or its control or safety system.
Purpose of LOPA
LOPA was developed to help answer questions such as:
• What layers of protection are needed to meet our risk goals?
• How much risk reduction does each layer provide or need to provide?
LOPA can help answer these questions with less time and effort than a full quantitative risk analysis (QRA), although there are instances when use of a complete QRA may be warranted.
Procedure for Conducting LOPA
A LOPA scenario is defined as a single initiating event and consequence pair. LOPA is performed for one scenario at a time. The frequency of initiating events, the IPLs risk reduction factors, and the severity of the consequence are all estimated within an order of magnitude. This data is then used in conjunction with the company or site-approved risk matrix to assess the resultant risk.
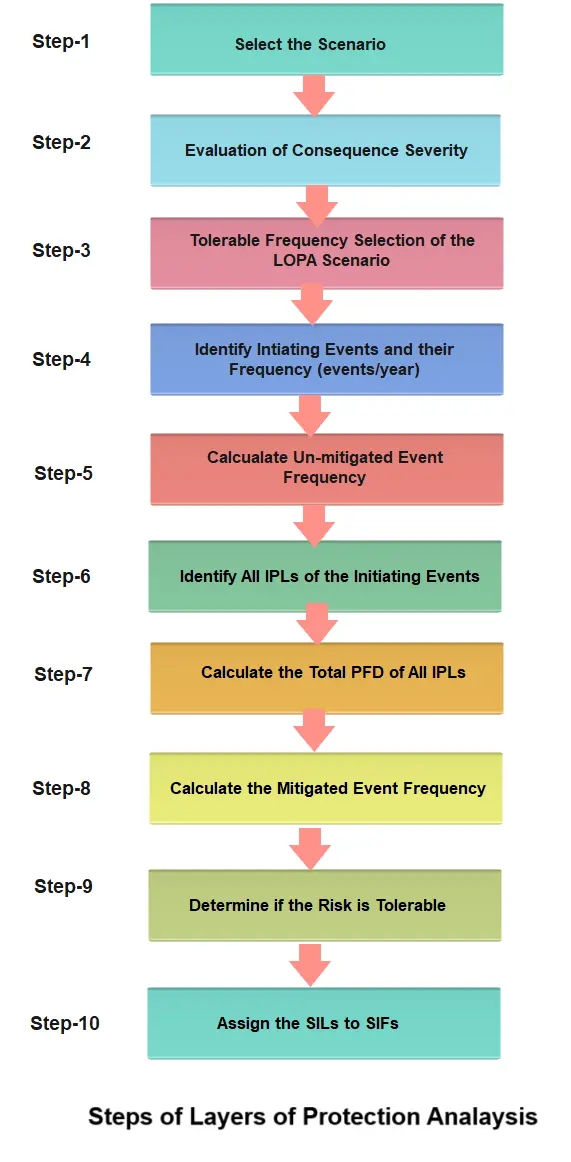
1. Identity High-Risk Scenarios for LOPA
LOPA builds on the information developed during a qualitative hazard evaluation, such as a process hazard analysis (PHA). Since LOPA typically evaluates scenarios that have been developed in a prior study, the first step by the LOPA analyst(s) is to screen these scenarios, and the most common screening method is based on consequence. The consequence is typically identified during a qualitative hazard review (such as a HAZOP study). Next the analyst evaluates the consequence (including the impact) and estimates its magnitude.
A scenario is an event that could lead to an outcome of concern. In LOPA, each scenario is a unique cause-consequence pair, where one initiating event leads to a chain of events that can result in a specific consequence of concern.
HAZOP assesses each identified hazard by documenting the initiating event cause and the protection layers that prevent or mitigate the hazard and reduce the risk. All SIFs, ESDs and high-risk scenarios identified during HAZOP are selected for LOPA analysis. Companies may establish their own criteria such as consequence severity or the risk-level assessment by the PHA team for the selection of scenarios to be evaluated using LOPA. The goal of a LOPA is to focus on scenarios with the greatest risk.
Once all high-risk potential scenarios are selected and listed, LOPA is applied to one scenario at a time. e. The scenario describes a single cause–consequence pair.
Scenario Example:
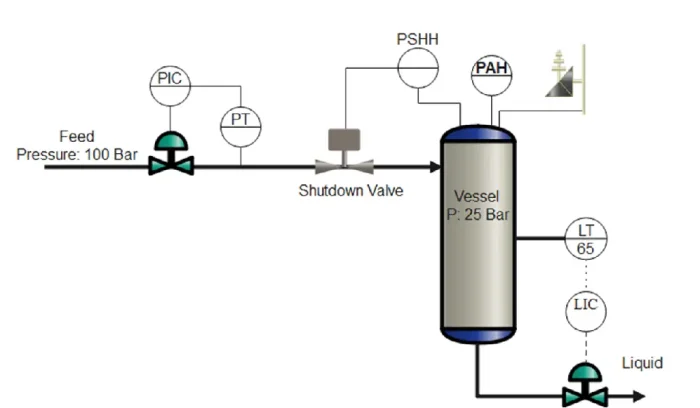
Release of Naphtha due to vessel over-pressurization, rupture and leakage leading to potential ignition, fire and multiple fatalities.
2. Evaluation of Consequence Severity
Generally, the HAZOP or hazard identification stage will describe the consequence but will not assign the category of severity. The LOPA review team will then provide the particular severity category by using the company’s risk matrix. Care should be taken by the LOPA review team to ensure consequence was estimated assuming no safeguards were in place.
Sometimes, consequence modelling is required to determine the severity of the consequence, and the LOPA team will typically need to do their work offline or in some cases engage an external specialist for consequence analysis. Fully un-mitigated Risk is calculated assuming no safeguards or IPLs as follows;
Fully unmitigated risk=Initiating event frequency × Consequence severity
3. Tolerable Frequency Selection of the LOPA Scenario
The tolerable frequency of a hazardous consequence occurring as a result of the scenario is the value being determined by this analysis. Scenario frequencies calculated by LOPA can be expressed in a variety of ways, such as the frequency of loss-of-containment events per year or fatalities per year.
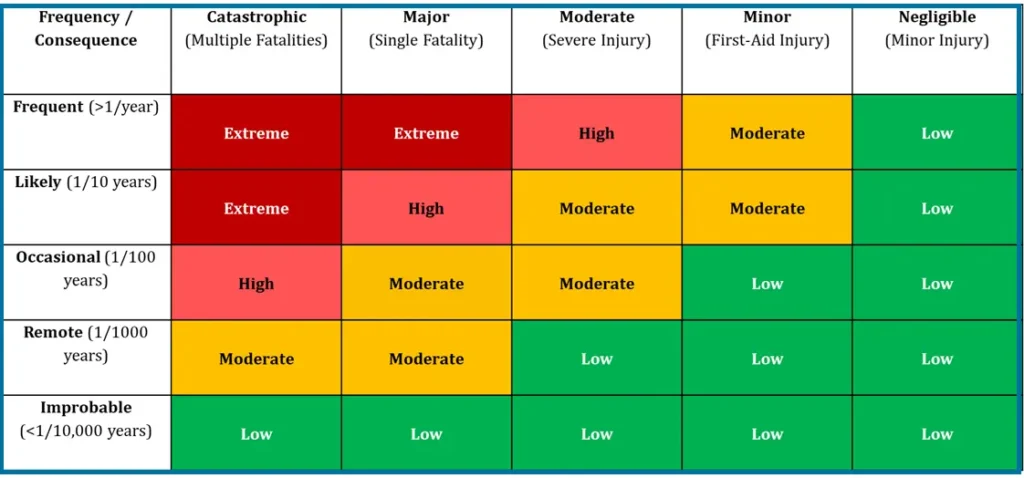
The tolerable risk values selected often range from 10-2 to 10-6 per year. Risk matrixes are often used to guide the safety engineers as to what portions of the hazard analysis should follow through on an LOPA analysis.
Below Fig. is an example of a risk matrix, which indicates the risk tolerance criteria for various categories of scenarios, depending on their severity. The more serious the consequence is, the lower the tolerable frequency, and the more protection layers are needed. Companies develop their own risk tolerance criteria, and would generally assign a tolerable risk frequency, or a required number of IPLs, to each category of potential consequence.
4. Identify the Initiating Event of the Scenario and Determine its Frequency (events per year)
Identify all initiating events of the selected scenario and determine the event frequency. In this step, the frequency of a consequence, given the failure of all IPLs/Safeguards, is determined. The frequency has to be based on the background of the scenario, like how often an operation causing an event is actually exercised.
An initiating event is a failure that starts a sequence of events that, if not interrupted by the successful operation of a layer of protection, results in a hazardous outcome.The most common initiating events for LOPA scenarios relate to equipment failure and human error.
Examples of common initiating events include mechanical failure, operator error, and control loop failure. Failure of the Basic Process Control System (BPCS) Pressure Controller, PCV failed to open its frequency is 1×10⁻¹.
5. Identify Enabling Conditions and Conditional Modifiers
Enabling conditions are conditions that must be present to allow the event to cause the consequence of concern. An enabling condition is a factor that determines whether the initiating event is possible. For example, suppose the initiating event is the freezing of a liquid in a pipe resulting from a trace heating failure. This may be possible only when the ambient temperature is below the freezing point, which could be for only a fraction of the year on average.
On the other hand, conditional modifiers are the conditions that must be present for the hazard scenario to develop into the consequence of concern. After all layers of protection have failed, there may be an additional factor that determines whether a severe outcome occurs. For example, if a release of flammable material occurs, ignition may not occur, and the worst outcome may be averted. Such a factor is known as a conditional modifier and is used to reflect the fact that the worst case may not always happen.
Both are expressed as probabilities. Some companies do not use enabling conditions and condition modifiers to make the calculations simpler and more conservative. However, if these are applied properly, more accurate estimations of a risk scenario can be achieved.
Care must be taken to ensure the hazard identification team did not already account for a given enabling condition or conditional modifier when estimating the frequency or severity of the consequence in the hazard identification review. For example,
suppose low temperature can lead to power failure (e.g. due to ice damage to power lines).
6. Determine the Frequency of Unmitigated Event
Calculate the frequency of the unmitigated event by multiplying the frequency of the initiating event, probability of enabling condition and conditional modifiers. If the risk of an unmitigated event is found to be less than the tolerable risk, we simply document the decision and move to the next scenario with no further work or risk reduction required.
UME = Frequency of the initiating event × Enabling Condition × Conditions Modifier
7. Identify All IPLs and Find the PFD of Each IPL
Identify IPLs and estimate their probability of failure on demand. The effectiveness of the IPL or safeguard is quantified as the probability of failure on demand (PFD). The LOPA team must review all safeguards documented during the hazard identification and determine if they qualify to be IPLs.
For a safeguard to qualify as an IPL it must be specific, independent, dependable, and auditable. For the simplified LOPA each IPL must provide at least a factor of 10 risk reduction. Therefore, all IPLS are safeguarded, but all safeguards are not IPLs. The team should also determine if there are any IPLs overlooked during the Hazard Identification stage that can be redesigned to qualify as IPLs.
8. Calculate the Total PFD of All IPLs
The effectiveness of an IPL is quantified in terms of its probability of failure on demand (PFD) which is defined as the probability that a system (in this case the IPL) will fail to perform a specified function on demand. The PFD is a dimensionless number between 0 and 1. The smaller the value of the PFD, the larger the reduction in the frequency of the consequence for a given initiating event frequency. The “reduction in frequency” achieved by an IPL is sometimes termed the “risk reduction factor.
PFD values used within an organization should be applied consistently, although variations between different facilities are appropriate if justified by differences in design, construction, installation, inspection or maintenance. The PFD values should also be consistent with the failure rates used to develop initiating event frequencies and risk tolerance criteria.
Sources for PFD values for the IPLs include OREDA (Offshore Reliability Data), Exida, company-specific failure records, SAFER-Reliability Data Library, Vendors supplied data, or Center for Chemical Process Safety guidelines etc.
Total PFD of All IPLs (Total Risk Reduction) = (PFD of IPL1) × (PFD of IPL2) × (PFD of IPL3)…..
9. Calculate the Mitigated Event Frequency
MEF=Unmitigated Event Frequency × Total PFD of All IPLs
10. Determine if the Risk is Tolerable
If the intermediate event frequency calculated in step 11, is greater than the tolerable event frequency for the scenario’s consequence category, then additional risk reduction will be required. In a simplified LOPA, the additional risk reduction required will be one, two or three orders of magnitude. If the risk is found to be tolerable, we simply document that no associated SIF is required and start analyzing the next scenario.
Risk Reduction Factor = Mitigated Event Frequency/Likelihood / Tolerable Event Frequency
Calculate the Risk Reduction Factor and identify the gap of risk. If RRF after applying the SIF is Zero then, the risk is tolerable, and if more than zero then find the SIL of SIF as per following table.

11. Assign the SILs to SIFs
If a SIF is needed, its SIL target will be selected using the risk reduction requirement as per following table;
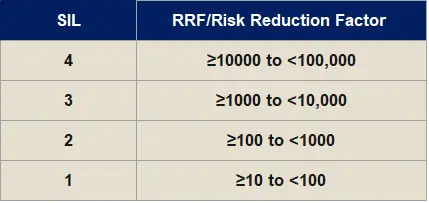
SIL 3 & SIL 4 should be rare. Furthermore, certain companies will require the process to be redesigned if a SIL 4 SIF is identified since that is typically an easier and cheaper path to manage the overall risk. As a general rules, if more than 25% of the SIFs are SIL 3 or 4, the LOPA review should be put on hold and the root cause of the high SILs should be determined.
SIL is calculated in terms of RRF or PFD.
12. Determine How to Provide Additional Risk Reduction
If additional risk reduction is required, the LOPA team has several options.
- Redesign the system to lower the initiating event frequency or consequence severity
- Re-deign an existing IPL to provide additional risk reduction
- Analyze the scenario using less conservative more quantitative technique
- Recommend a SIF be designed and implemented to mitigate the risk.
Redesigning the system to lower the initiating event frequency or consequence severity should always be the first option investigated since doing this would help to avoid the hazard in the first place instead of actively trying to prevent it from propagating into the incident.
Analyzing the scenario with a more quantitative technique is also preferred since it will determine if additional risk reduction is really required and could eliminate the design, installation and maintenance costs of new IPLS or SIFs.
Top References
- Practical SIL Target Selection by Heidi Hartman, Dr. Eric Scharpf and Hal Thomas
- Layer of Protection Analysis, Simplified Process Risk Assessment by Center for Chemical Process Safety
- Basic Introduction to SIL Assessment using Layers of Protection Analysis (LOPA) by Fiaz Moazzam.
- IEC 5611Standard
- https://education.aiche.org
- Layer of Protection Analysis by Ronald J. WILLEY
- https://core.ac.uk/download/pdf/81971209.pdf
- Functional Safety from Scratch by Peter Clarke
- Guidelines for Initiating Event and Independent Protection Layers in LOPA by CCPS.
